3.5 million Americans experience homelessness every year
1.35 million American children will experience homelessness this year
800,000 American men, women, and children experience homelessness each night
As a result of research and accessibility constraints, studies on homelessness are limited to counting people who are in shelters or on the streets. This results in underestimates of homelessness. Many people who lack a stable, permanent residence have few shelter options because shelters are filled to capacity or are unavailable. US Conference of Mayors Report, 2007
Note: No estimates on the number of people experiencing homelessness can be a true representation of how many people are experiencing housing insecurity. However, African American and LGBTQi individuals are affected by homelessness at a much higher rate, compared to white, cis, heterosexual individuals.
Need to know:
- Affordable housing has been disappearing
- Jobs have also been disappearing
- The value of minimum wage has dropped
- Value of welfare has dropped, become harder to get
- So people are earning less, having trouble paying for housing, and when they lose their housing or their jobs, welfare isn’t there.
National Demographics: National Alliance to End Homelessness
Family Homelessness Demographics
- 39% of people experiencing homelessness are children
- 45% of children who experience housing insecurity are under the age of 5
- Families are the fastest-growing segment
- Families with children (as opposed to single homeless people) make up about 30% of the homeless population nationally
- Single men comprise 51% of the urban homeless population
- Single women comprise about 17%
- Unaccompanied children make up about 2% of the homeless population
 Race
Race
- The homeless population is 49% African-American, 35% Caucasian, 13% Hispanic, 2% Native American, and 1% Asian.
- The ethnic makeup of homeless populations varies according to geographic location. People experiencing homelessness in rural areas are much more likely to be white; homelessness among Native Americans and migrant workers is also largely a rural phenomenon.
Veterans
In January 2014, communities across America identified 49,933 veterans experiencing homelessness during a point-in-time count (PIT Count). Veterans are about 8.5% of the total homeless population. This represents a substantial decrease (67.4%) in the number of homeless veterans counted only five years previously in 2009.
Mental Illness
- About 16% of people experiencing homelessness have severe chronic mental illness.
Substance Abuse
- About 26% of the homeless population suffers from some form of drug abuse (including alcohol). Drug use is often a coping mechanism of living in dangerous and unsettled situations. This does not mean that drug abuse led to homelessness.
Poverty
Homelessness and poverty are inextricably linked. People living in poverty are frequently unable to pay for housing, food, childcare, health care, and education. Difficult choices must be made when limited resources cover only some of these necessities. Often it is housing, which absorbs a high proportion of income that must be dropped. If you live in poverty, you are essentially an illness, an accident, or a paycheck away from living on the streets.
- Minimum wage is currently $10.45/hr. in Ohio
- The minimum wage in 1970, when adjusted for inflation, was $12 in 2023 dollars, but today livable wage estimates are between $20-$55 per hour.
- If minimum wage kept up with productivity, it would be over $21 per hour.
- Unemployment rates don’t take livable wages in account, but the US unemployment rate in 2016 is 4.9%. (OH 4.7%, KY 4.9%, IN 4.4%)
 No county or city in the country has enough affordable housing, transitional housing, and/or shelter beds for those who need it.
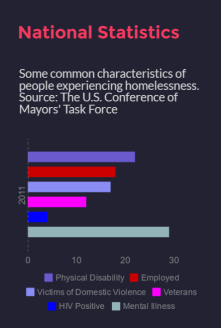
Data from The U.S. Conference of Mayors’ Task Force on Hunger and Homelessness
- 6% increase in the number of people experiencing homelessness
- 7% the number of unaccompanied individuals experiencing homelessness over the past year has increased
- 50% of the cities expect the number of families experiencing homelessness to increase moderately next year.
- 38 of the cities expect the number of unaccompanied individuals to increase moderately next year
- 25% of the demand for emergency shelter is estimated to have gone unmet
- 76% of shelters had to turn away families with children.
- 61% of shelters had to turn away unaccompanied individuals.
- Individual characteristics
- 29% of homeless adults were severely mentally ill
- 22% were physically disabled
- 18% were employed
- 17% were victims of domestic violence
- 12% were veterans
- 4% were HIV positive
- 66% of cities saw increased need for emergency food assistance
- 67% requesting emergency food assistance were families
- 42% were employed, 23% were elderly, and 10% were experiencing homelessness
- 3% average increase in the number of pounds of food distributed during the past year
- 23% of the emergency food assistance is estimated to have been unmet
- 47% of the responding cities the emergency kitchens and food pantries had to reduce the quantity of food persons could receive at each food pantry visit or the amount of food offered per meal at emergency kitchens
- In 57% of the cities, they had to reduce the number of times a person or family could visit a food pantry each month
- 57% of the cities facilities had to turn away people because of lack of resources
- 65% of the survey cities expected requests for emergency food assistance
- 59% of cities expect that resources for the emergency food assistance will stay the same over the next year
- 35% of the cities expecting a moderate increase, and
- 5% expecting a moderate decrease.
Violence: National Coalition for the Homeless
- In the past 15 years (1999-2013) there have been 1,437 documented acts of violence against people who are experiencing homelessness
- 375 of the victims have lost their lives
- Reported violence has occurred in 47 states, Puerto Rico, and Washington, DC
- Perpetrators of these attacks were generally male and under the age 30
- In 2013
- 85% of all perpetrators were under the age of 30
- 93% of all perpetrators were male
- 65% of all victims were 40 years old or older
- 90% of all victims were male
- 18 of the 109 attacks resulted in death
Teens: The Covenant House
- 14.9% of the youth experienced some form of trafficking victimization, consistent with the definition under federal law, TVPA (Trafficking and Violence Protection Act)
- 22.9% (over the age of 18) engaged in survival sex
- ¼ of the youth either was a victim of trafficking or had engaged in survival sex at some point in his or her life
- Over 1/3 were designated trafficking victims because they traded sex for something of value involving no apparent coercion prior to age 18
- 48% of youth said shelter was the number one commodity traded in return for sexual activity
Cincinnati: The State of Black America, pg vi – vii
Greater Cincinnati was ranked at the bottom (#73 of 77 cites ranked) in median household income disparity and many other factors comparing African American and white families.
- African American median household income ($24,272) is less than half of the white median household income ($57,481)
- Of the 14,000 families living in poverty in Cincinnati from 2005-2009, 76% were African American
- In Cincinnati, the life expectancy for African American men (73.8 years) is 10 years less than white men
- The life expectancy for African American women (72.4 years) is also less than that of white women (79 years)
- In Cincinnati Public Schools 63.2% of the population is African American, 24.6% white
- 81.9% of the African American students that attend CPS live in economically disadvantaged families
- 52% of all children in Cincinnati (ages 6 and under) face poverty
- 74% of Cincinnati’s African American children face poverty
- African Americans are over represented in the prison population (45%)
- 17.1% of African Americans are unemployed, while the rate for whites is less than half of that amount (7.1%)
Cincinnati Demographics:
Strategies to End Homelessness in 2014
- Homeless youth (under age of 18, unaccompanied by an adult) make up about 10% of the homeless population
- 43% of the homeless population is under the age of 25
- Approximately 15% of clients at local shelter for young adults (ages 18 to 24) self-identify as gay or transgender. National estimates show 40% of youth are LGBTQi, but may not feel safe enough to report it.
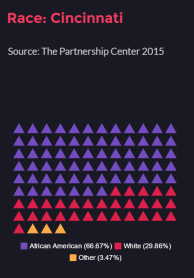
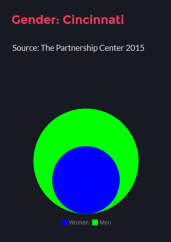
The Partnership Center (2015) shows 11,807 people experiencing homelessness were documented:
 7,830 (66.3%) were African American
- 7,172 (60.7%) were men
- 4,607 (39%) were women
- 3,684 (31.2%) were between the ages of 35-54
- 3,507 (29.7%) were White
- 3,454 (29.3%) were under the age of 18
- 2,902 (24.5%) were between the age of 18-34
- 1749 (14.8%) were between the ages of 55 and over
- 358 (3%) were Multi-Racial
- 29 (0.24%) were American Indian/ Alaskan Native
- 24 (.20% ) were transgender
- 18 (0.15%) were Asian

One thought on “Fact Sheet”